i. Preamble
Eidolon is written in Objective C, a very elegant language which is implemented on NeXTStep OS. However, using it on other systems is not easy.
The GNUstep project attempts to adapt the NeXT environment for gnu-linux and unix systems.
The GNUstep project is still ... a project with all problems it implies. However it is already possible to do programming and implementations with the GNUstep API : have a look at WindowMaker.
Debugging objective-c is easy for monofiles programs as the code can be recognised as C code, whereas for multi-files multi-subprojects packages like eidolon, it is not possible because messaging (NB: [object selector:argument] ) is not supported by gdb and object method calls - the core of objective-c programming - not recognized.
It is possible to debug manually using the translated commands (C syntax) of objective-c : have a look at this article. As you can see the syntax is not natural and quite complicated for arborescent projects.
3. patch GDB
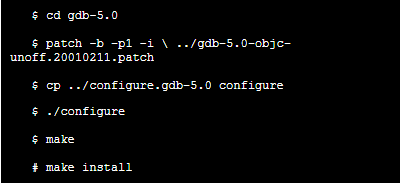
Just download and install the last version of gnu gdb (the gnu debugger) from ftp://ftp.gnu.org/gnu/gdb/ (file: gdb-5.0.tar.gz)
The following additionnal packages are required :
gdb-5.0-objc-unoff.20010211.patch
And the Configure add-on
configure.gdb-5.0
download the three packages in the same directory as gdb-5.0.tar.gz then build the complete package:

The patched gdb is installed on the default directory (/usr/local/).
Note: the binary file (gdb) takes place into /usr/local/bin.
This information can be found on: http://www.made-it.com/GNUstep/Build/gdb.html
If the patch function asks you for a filename or display hunk errors, this is probably because you use an old patch command. The one tested here was Patch v2.5.4
type
$ patch --version
to obtain the version number (no answer -> this is an old version!)
2. Launch and quit GDB
Just run gdb with the compiled Simulator file as argument, ensure you are in the Eidolon directory :
$ cd Eidolon
$ gdb Simulator
NOTE : to be sure the patch has been applied you can type then
(gdb) SET LANGUAGE objective-cIf gdb does not recognize the language, the patch is not applied.
- Simulator must have been compiled with the -g flag applied to gcc. It is set by default in the makefile...)
To quit gdb just type
(gdb) quit
To set the simulation type (Emission/Transmission) :
The simulation type is defined with the argument given to the simulator.
$ set arg tr
The command defines the argument list you want to pass to Simulator. Here, "tr" is the way to perform a Transmission Simulation.
2. Run the program
If the modification you have done to the package result in an error message BUT the compilation succeeds, this is probably a segmentation fault (core dumped...). Sometimes, just running the programm with gdb will give you more information on the cause : load gdb with the Simulator, fix the arguments eventually, and run :
(gdb) run
You will get the same output as if you were running the software outside from gdb.
If you use printf, it is possible that the segementation/core dumped signal comes AFTER the real place it is emitted from!
So it is possible to run the programm partially, to stop somewhere, to execute line by line, and this is the way to know exactly how Simulator is working.
3. Configuration file paths
If you run Simulator in gdb, using transmission argument, you could get an error because the debugger cannot open files, like setup.txt in the Simulation_main.m. Actually gdb uses the $HOME environment variable to locate files the program uses.
Just unset the $HOME variable to delete the preset path :
(gdb) unset environment HOME
Then it should run without problems.
4. Fix breakpoints
This is a key function of GDB. To explore the state of the program and its influence on its environment, you can freeze the program at a step of its execution. This will be done using breakpoints.
Break at line ... :
Il you have a doubt on a function or on a line of your program, just put a break at a line before the line you suspect.
(gdb) break 143
A break is now put at line 143.
Then run the program ((gdb) run), it will stop at line 143, and if you run again, it will resume. When the program is stopped, you have access to all variable and objects which exist at this step in the program.
Break at function
.. [not finished yet]
All commands can be run from the ddd frontend (not tested with xxgdb). The DDD project provide a GUI to use GDB in a friendly environment. As it is based on the command-line GDB, in does not require additional configuration to run and debug Obj-C programs.